The Problem with ACoS-Only Thinking
ACoS measures the ratio of ad spend to ad-attributed revenue. A 15% ACoS on a product with a 40% gross margin is very different from a 15% ACoS on a product with a 20% gross margin. One is profitable, the other is losing money - and ACoS alone won't tell you which.
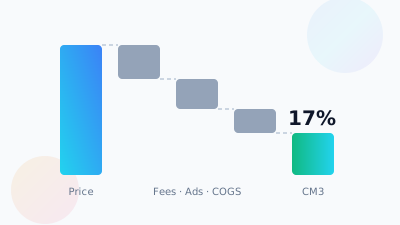
The metric that matters for true profitability is TACoS (Total Advertising Cost of Sales), calculated against all revenue (not just ad-attributed revenue), and then layered against your full cost stack.
The Full Amazon P&L Formula
− Amazon Referral Fee (typically 8 to 15%)
− FBA Fulfillment Fee (per unit, size-based)
− FBA Storage Fee (monthly, ASIN-level)
− COGS (your product cost + shipping to FBA)
− Advertising Spend (all campaigns)
− Return Allowance (% of revenue)
− Reimbursements, Platform Fees
= Net Profit ($)
Real Example: What "18% ACoS" Actually Means
| Line Item | Amount | % of Revenue |
|---|---|---|
| Revenue (monthly) | $50,000 | 100% |
| Amazon Referral Fee (12%) | -$6,000 | 12% |
| FBA Fulfillment Fees | -$7,500 | 15% |
| FBA Storage Fees | -$800 | 1.6% |
| COGS (product + inbound) | -$17,500 | 35% |
| Ad Spend (18% ACoS on 60% ad-attributed) | -$5,400 | 10.8% |
| Returns & Allowances (~3%) | -$1,500 | 3% |
| True Net Profit | $11,300 | 22.6% |
In this example, 18% ACoS with a 35% COGS and 12% referral fee leaves a 22.6% net margin - which is actually good. But change the COGS to 50% (common in apparel or electronics) and the same 18% ACoS leaves you at 7.6% net margin, making scale unprofitable.
TACoS: The Metric That Actually Matters for Scale
TACoS = Total Ad Spend ÷ Total Revenue × 100
Unlike ACoS (which only counts ad-attributed revenue), TACoS measures advertising efficiency against your entire revenue. A falling TACoS over time is the single best indicator that organic rank is building and your business is becoming more profitable as it scales.
- TACoS 20%+: Heavy reliance on PPC, organic rank not established yet (typical in launch phase)
- TACoS 10 to 20%: Growing organic presence, healthy mix of paid and organic
- TACoS below 10%: Strong organic rank, PPC is amplifying rather than driving revenue
How to Build Your Amazon P&L in 5 Steps
- Step 1: Pull your Sales & Traffic report from Business Reports - get total revenue by ASIN
- Step 2: Pull your FBA Fee report - get exact fulfillment + storage fees per ASIN per month
- Step 3: Add your COGS including all inbound shipping, prep, and overhead allocated to Amazon
- Step 4: Pull total ad spend from Advertising Console - both Sponsored and DSP
- Step 5: Apply your average return rate (find in Returns Report) and referral fee percentage
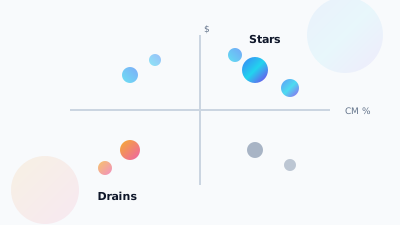
Build this in a spreadsheet by ASIN. You'll immediately see which products are your profit drivers and which are quietly destroying margin.
The Most Common Hidden Cost: Long-Term Storage Fees
Amazon charges significantly higher storage fees for inventory that has been in FCA for more than 180 days and 365 days. Brands that don't monitor ASIN-level inventory age often have 10 to 15% of their SKUs silently costing them $2 to 4 per unit per month in excess storage - wiping out their margin completely.
Frequently Asked Questions
That depends entirely on your margin. A 15% ACoS on a product with a 40% gross margin is very different from the same ACoS on a 20% margin product. One is profitable, the other is losing money, and ACoS on its own won't tell you which. You need the full cost stack to judge it.
ACoS measures ad spend against ad-attributed revenue only. TACoS measures total ad spend against your entire revenue, so it shows how much of the business advertising is actually carrying. TACoS of 20% or more suggests heavy PPC reliance typical of launch, 10 to 20% a healthy paid and organic mix, and below 10% strong organic rank.
Pull total revenue by ASIN from the Sales and Traffic report in Business Reports, then exact fulfillment and storage fees per ASIN from the FBA Fee report. Add COGS including inbound shipping, prep and allocated overhead, pull total ad spend from the Advertising Console, and apply your average return rate and referral fee percentage in a spreadsheet.
Long-term storage fees on aged inventory. Amazon charges significantly higher storage rates once units pass 180 days and again at 365 days. Brands that don't watch inventory age at ASIN level often have 10 to 15% of their SKUs quietly costing $2 to $4 per unit per month in excess storage, which can wipe out the margin.
Want a Full P&L Analysis of Your Amazon Account?
SellerVine builds per-ASIN P&L dashboards for every client so you always know exactly where your profit is - and where it's leaking.
Get My Free Account Audit →