Ask most Amazon sellers their revenue and they answer instantly. Ask their contribution margin per unit — the money actually left after Amazon, advertising, and the product itself take their cuts — and the answer is usually a pause, then a guess, and the guess is usually high.
Contribution margin is the single number that tells you whether growth is building a business or just moving money: every incremental unit either contributes toward fixed costs and profit, or it quietly destroys value at scale. Sellers who scale on revenue without knowing CM per SKU are the ones who post record months and empty bank accounts simultaneously.
This guide builds the full model: the cost waterfall from list price down to true contribution, the three CM tiers and what each is for, worked examples with real fee structures, and the decisions each number should drive.
The Full Cost Waterfall: Price to Profit
Contribution margin is what survives this sequence. Every line applies per unit, and most sellers are missing at least two of them in their spreadsheets:
| Layer | Typical range | Notes |
|---|---|---|
| Selling price | — | Net of any coupon/deal funding, which is your cost, not Amazon’s |
| Referral fee | 8–15% of price | 15% in most categories; lower in some (e.g. appliances tiers) |
| FBA fulfilment fee | By size/weight tier | The full pick-pack-ship fee; check the current rate card, not last year’s |
| Storage (monthly + surcharges) | $0.30–$2.40+/unit-month equiv. | Including aged-inventory surcharges and peak-season rates, averaged per unit |
| Inbound costs | freight + placement fees | Inbound placement service fees added a real per-unit cost line in 2024 |
| Returns cost | 1–8% of price equiv. | Refund minus recovered value, plus processing; category-dependent |
| Landed COGS | — | Factory cost + freight + duty + inspection, per unit |
| Advertising (allocated) | TACoS % of price | Total ad spend ÷ total revenue, applied per unit honestly |
The three lines sellers most often omit: returns cost, storage surcharges, and inbound placement fees. Together they routinely account for 4–8 points of margin — enough to turn a "25% margin" SKU into a 17% one.
CM1, CM2, CM3: Three Numbers, Three Jobs
One margin number cannot serve every decision, which is why operators use tiers:
- CM1 = Price − Amazon fees − landed COGS. The product’s structural economics. If CM1 is weak, no marketing fix exists — the product, price, or sourcing must change.
- CM2 = CM1 − variable logistics (storage, inbound, returns). The operational truth. Healthy CM1 with sagging CM2 means an ops problem: slow turns, aged surcharges, damage rates.
- CM3 = CM2 − allocated advertising. The growth truth. This is the number that decides whether scaling spend builds profit or buys vanity revenue.
The diagnostic power is in the gaps between tiers: a big CM1→CM2 gap is an operations project; a big CM2→CM3 gap is an advertising-efficiency project. Sellers who track only "profit" can feel the pain but cannot locate it.
A Worked Example With Real Numbers
A $34.99 kitchen product, standard-size 1.4lb, 15% referral category:
| Line | Amount | Running total |
|---|---|---|
| Selling price | $34.99 | $34.99 |
| Referral fee (15%) | −$5.25 | $29.74 |
| FBA fulfilment fee | −$6.62 | $23.12 |
| Storage incl. surcharges (avg/unit) | −$0.55 | $22.57 |
| Inbound freight + placement (avg/unit) | −$1.10 | $21.47 |
| Returns cost (3.5% of price equiv.) | −$1.22 | $20.25 |
| Landed COGS | −$9.40 | $10.85 (CM2 = 31%) |
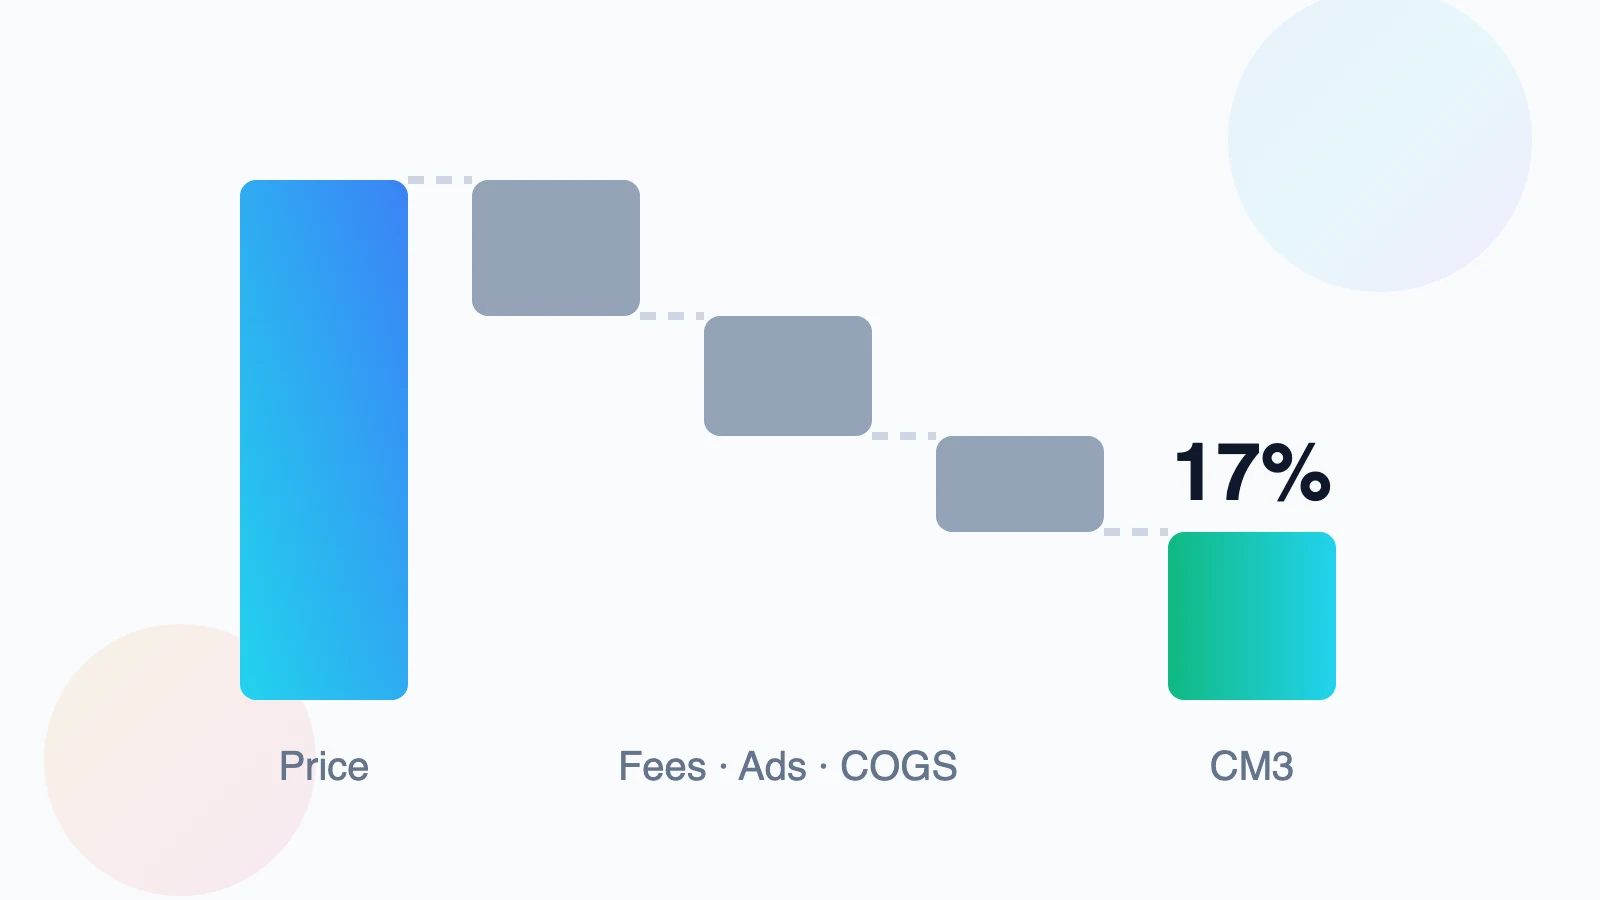
| Advertising at 14% TACoS | −$4.90 | $5.95 (CM3 = 17%) |
Note what the example shows: a product that looks like a "31% margin" item in a naive spreadsheet is a 17% item once advertising is honestly allocated — still healthy, but with very different implications for how much launch spend or price discounting it can absorb.
The Decisions Each Number Should Drive
- Kill/fix list: rank the catalog by CM3 × monthly units. Negative-CM3 SKUs are funded by your winners — fix price, cost, or ads within a deadline, or exit deliberately.
- Ad budgeting per SKU: maximum sustainable TACoS = CM2 % minus your required profit floor. A SKU with 31% CM2 and a 10% profit target can spend up to ~21% TACoS in steady state, more only during deliberate launch windows.
- Price testing: model CM3 at ±5–10% price points before testing; a 5% price rise often lifts unit contribution 15–25% and survives modest conversion loss.
- Sourcing negotiations: a $0.60 COGS reduction on the example above is +10% contribution — usually easier to win than 3 points of ACOS.
- Bundle/pack-size design: multi-packs amortise fulfilment fees per unit sold — the same product at 2-pack frequently jumps 5–8 CM points.
Making It a System Instead of a Spreadsheet Event
Contribution margin decays without maintenance — fees change twice a year, freight moves quarterly, TACoS drifts monthly. The working cadence: refresh the fee lines from Amazon’s actual rate card and your SKU dimensions each rate change; recompute returns cost quarterly from real refund data (not assumptions); allocate advertising monthly at the SKU level from search-term reports; and publish one CM3-per-SKU table the whole team can see. Ten SKUs fit in a spreadsheet; at a hundred, tooling or an analytics stack earns its keep. Either way, the discipline is identical — every SKU, every month, one honest number.
Frequently Asked Questions
What is a good contribution margin for an Amazon product?
As working benchmarks: CM3 above 20% is strong and scalable; 10–20% is workable with efficient ads; 0–10% is fragile — one fee increase from breakeven; negative CM3 means every sale loses money. Structural CM1 below ~40% usually cannot fund advertising at all.
Should advertising really be allocated per unit?
Yes — excluding ads is the most common self-deception in Amazon P&Ls. Use SKU-level ad spend from campaign reports where campaigns map to SKUs, or allocate brand-level spend by revenue share. Imperfect allocation beats pretending the cost is not there.
How do I calculate returns cost properly?
From real data: refunds issued minus value recovered (resold units, reimbursements), plus return processing fees, divided by units sold, for a trailing quarter per SKU. Category rates vary enormously — apparel can run 15%+ while consumables run under 2%.
Contribution margin vs. net profit — what is the difference?
Contribution margin covers price minus variable, per-unit costs; it measures whether each incremental sale helps. Net profit further subtracts fixed costs — salaries, software, overhead. CM is the per-SKU decision tool; net profit is the whole-business scoreboard.
My CM3 is negative during launch. Is that always wrong?
No — deliberately negative CM3 for a bounded launch window (buying rank and reviews) is a legitimate investment, if you model the payback and set an end date. The failure mode is unbounded "launch mode" that quietly becomes the permanent state.