An account-level P&L can look perfectly healthy while a third of the catalog loses money on every unit. The winners subsidise the losers, the blended number stays green, and the business quietly compounds a portfolio problem — until fees rise or a hero SKU slows, and the cross-subsidy snaps.
SKU-level profitability is the discipline of forcing every cost — every fee line, every storage dollar, every ad click — down to the individual product, so each SKU stands trial on its own economics. It is unglamorous work, and it changes more decisions than any other analysis an Amazon business runs: pricing, advertising allocation, inventory buys, and which products deserve to exist.
Here is the full build: data sources, allocation methodology for the awkward shared costs, the quadrant framework for acting on results, and the monthly cadence that keeps it alive.
The P&L Architecture: What Rolls Up to Each SKU
| Block | Lines | Source |
|---|---|---|
| Revenue | Gross sales, promo/coupon funding, refunds | Business reports + transaction data |
| Amazon fees | Referral, FBA fulfilment, refund admin | Fee transaction reports (actuals, not estimates) |
| Inventory costs | Monthly storage, aged surcharges, low-inventory fee, placement fees, removals | Storage/fee reports, allocated per unit |
| Returns economics | Fee leakage, unsellable COGS, processing | FBA returns + reimbursement reports |
| Product costs | Landed COGS per unit (factory + freight + duty + inspection) | Your supply-chain data, versioned by PO |
| Advertising | SP/SB/SD spend attributed per SKU | Advertising reports (see allocation below) |
| Result | CM3 per unit and per month | The number every decision uses |
Principle: use Amazon’s actual transaction-level fees, not calculator estimates. Fee actuals capture the surcharges, dimension updates, and category quirks that estimates miss — and those gaps are precisely where phantom profitability hides.
Allocating the Awkward Costs Honestly
Advertising
SP spend maps cleanly where campaigns are SKU-segmented (advertised-product reports). The awkward parts: Sponsored Brands driving multiple SKUs, halo sales, and brand campaigns. Workable convention: attribute directly where the data allows; allocate the remainder by attributed-revenue share; never leave brand spend unallocated — it is real money.
Storage
Monthly storage reports give per-unit-volume charges; aged surcharges attach to the specific SKUs incurring them. Allocate peak-season (Q4) rates to the months they occur — averaging them across the year flatters slow-turn SKUs exactly when you need the truth.
Landed COGS versioning
Freight and factory costs move; keep COGS versioned by PO so each month’s units carry the cost they actually arrived at. One static COGS number silently distorts every downstream decision within two quarters.
Fixed costs — deliberately excluded
Salaries, software, overhead stay out of SKU CM (they belong in the business P&L). The SKU question is contribution; mixing fixed costs in muddies the kill/scale logic.
The Four-Quadrant Portfolio Review
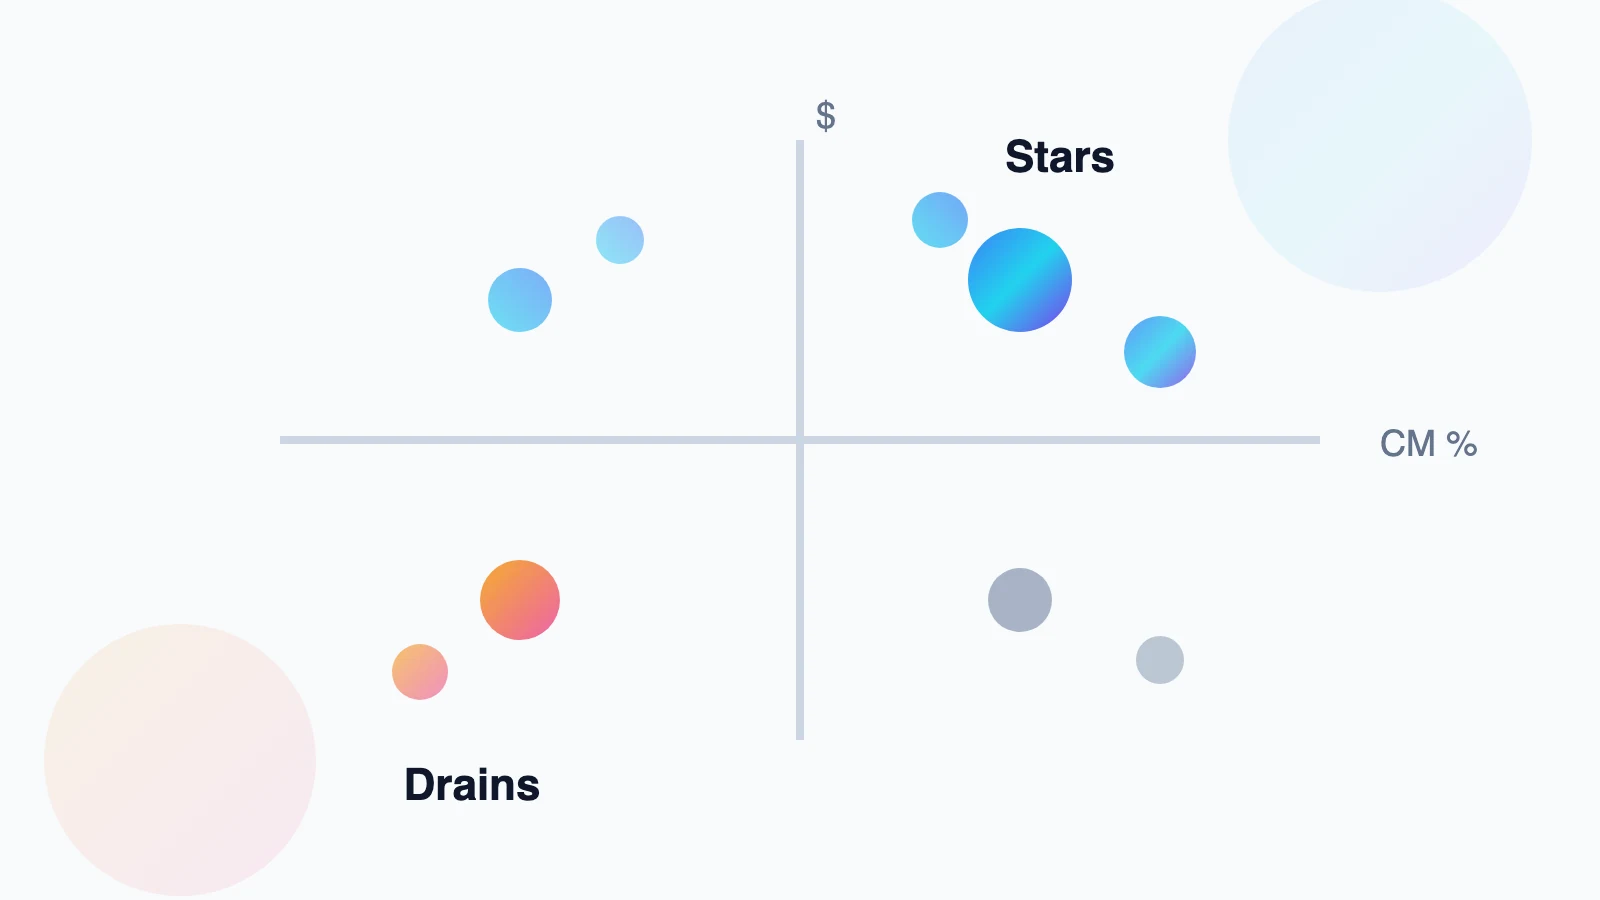
Plot every SKU: CM3 % on one axis, monthly contribution dollars (CM3 × units) on the other. Four quadrants, four playbooks:
- Stars (high %, high $): protect ruthlessly — stock depth, defended pricing, ad investment up to the marginal-return line. Most businesses under-invest here while over-managing problems.
- Workhorses (low %, high $): big absolute contributors with thin unit economics — the fee-sensitivity risk pool. Priorities: packaging tier drops, COGS negotiation, careful price tests. A 2-point margin gain here is worth more dollars than anywhere else.
- Question marks (high %, low $): profitable but small — usually starved of traffic. Test scaled ad spend; some are future stars, some are niche ceilings. Time-box the experiments.
- Drains (low/negative %, low $): the quiet portfolio tax. Fix on a deadline (price, cost, ads) or exit deliberately — clearance, bundle-out, discontinue. Every drain also consumes working capital and management attention beyond its P&L line.
The Monthly Cadence That Keeps It Honest
- Week 1: refresh the model with last month’s actuals; version any COGS/fee changes
- Review meeting: quadrant moves (who crossed lines and why), top 5 improvement actions with owners, kill-list decisions falling due
- Standing analyses: fee-change impact when Amazon updates rates; TACoS-vs-CM2 headroom per SKU for the ads team; aged-inventory exposure vs. surcharge cliffs
- Quarterly: full portfolio pruning review — the discipline that prevents the long tail from re-growing
- Tooling threshold: spreadsheets carry ~30–50 SKUs; beyond that, analytics tooling or a warehouse-based pipeline pays for itself in error reduction alone
The output that matters is not the dashboard — it is the decision log: prices changed, SKUs killed, packaging re-engineered, ad budgets moved, each tagged to the number that justified it. That log is also how you demonstrate, twelve months later, that the discipline paid.
Frequently Asked Questions
How is this different from the profit number my software shows?
Off-the-shelf dashboards are a good start but commonly mis-handle the edges: ad allocation for multi-SKU campaigns, storage surcharges, returns disposition outcomes, and COGS versioning. Use tooling for plumbing, but audit its assumptions against fee actuals quarterly — the edges are where SKUs flip from green to red.
What share of a typical catalog is unprofitable?
In our audits, 20–40% of SKUs are CM3-negative or near-zero in most established accounts — usually long-tail items launched hopefully and never re-examined. The winners fund them invisibly until the portfolio is stress-tested.
Should I immediately kill every negative-CM3 SKU?
No — sequence it: first check for cheap fixes (price +5%, packaging tier drop, ad cuts), account for strategic roles (variation completeness, cross-sell feeders), then exit the remainder deliberately via clearance or bundling. The discipline is the deadline, not the instant execution.
How do I handle SKUs sold in bundles and multi-packs?
Treat each sellable ASIN (single, 2-pack, bundle) as its own P&L line with its own fees and COGS, then optionally roll up to a parent-product view. Multi-packs often show meaningfully better CM than singles — that comparison is itself a pricing-architecture insight.
What is the minimum viable version if this feels heavy?
One spreadsheet: last 90 days, per SKU — revenue, Amazon fee actuals, landed COGS, SKU-attributed ad spend. That four-line version identifies most drains and stars within an afternoon, and the appetite for the fuller model follows the first uncomfortable discovery.